System Log for Debugging
System logs can be used for debugging purposes.
If you want to export the system log to a local PC or a remote server for debugging, you can set up the function on the web Upgrade > Diagnosis > System Log interface.
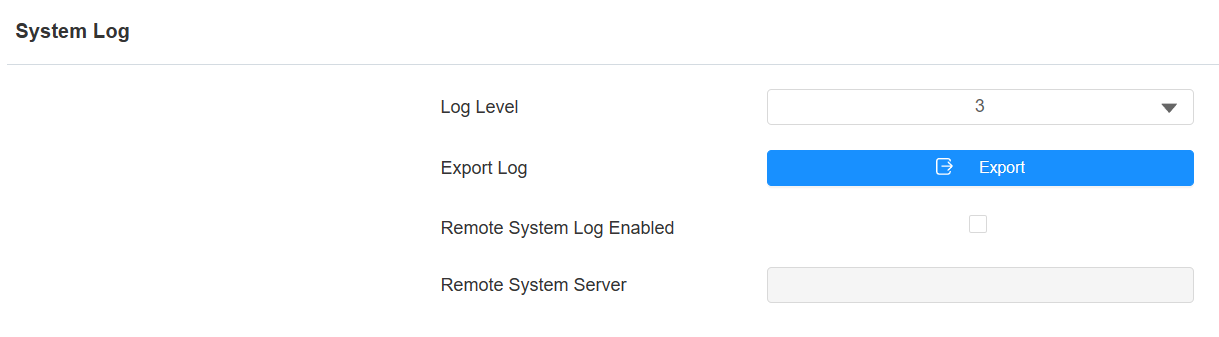
Log Level: Log level ranges from 0 to 7 levels. You will be instructed by Akuvox technical staff about the specific log level to be entered for debugging purposes. The default log level is 3. The higher the level is, the more complete the log is.
Export Log: Click the Export tab to export a temporary debug log file to a local PC.
Remote System Server: Enter the remote server address to receive the system log, and it will be provided by Akuvox technical support.
PCAP for Debugging
PCAP is used to capture the data package going in and out of the devices for debugging and troubleshooting purposes.
To set up PCAP, go to the web Upgrade > Diagnosis > PCAP interface.
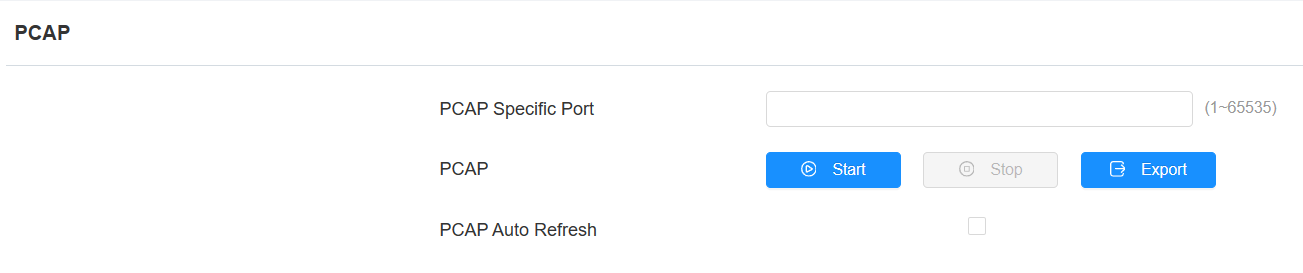
PCAP Specific Port: Select the specific port from 1-65535 so that only the data packet from the specific port can be captured. You can leave the field blank by default.
PCAP: Click the Start tab and Stop tab to capture a certain range of data packets before clicking the Export tab to export the data packets to your local PC.
PCAP Auto Refresh: When enabled, the PCAP will continue to capture data packets even after the data packets reach 50 MB in capacity. When disabled, the PCAP will stop data packet capturing when the data packets reach the maximum capturing capacity of 1MB.
Remote Debug Server
When the device is having a problem, you can use the remote debug server to access the device log remotely for debugging purposes.
Set it up on the Upgrade > Diagnosis interface.
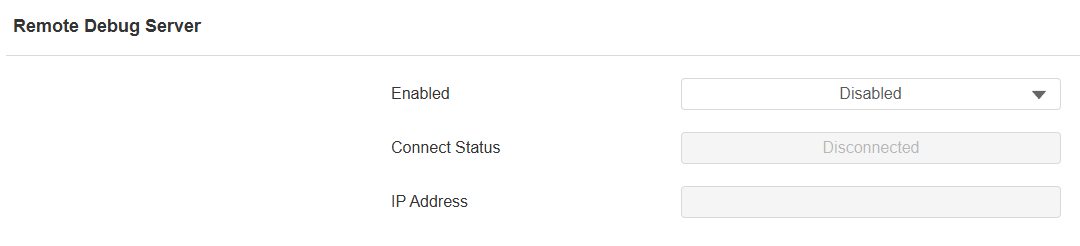
Connect Status: Indicate the remote debug server’s connection status.
IP: Specify the server’s IP address.
User Agent
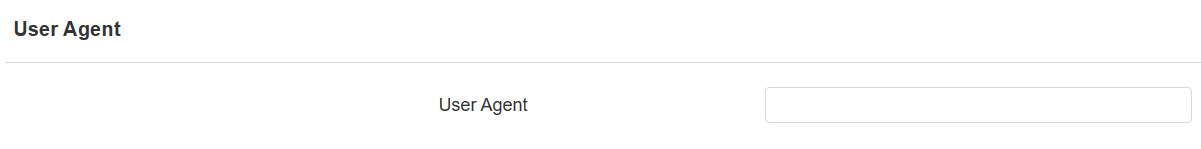
User agent is used for identification purpose when you are analyzing the SIP data packet.
To set it up, go to the web Account > Advanced > User Agent interface.
Capture Log
You can set up a remote server to receive the device’s capture log on the Upgrade > Diagnosis > Capture Log interface.
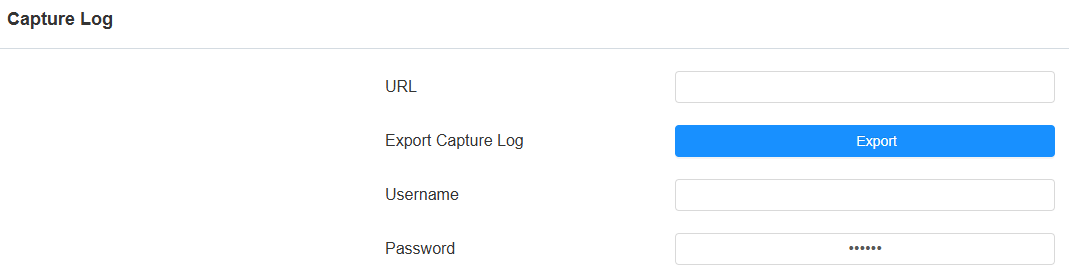
URL: Set the server address to receive the capture log.
Export Capture Log: Click Export to export the capture log to the local PC.
User Name: Set the username to access the server.
Password: Set the password to access the server.
Web Call
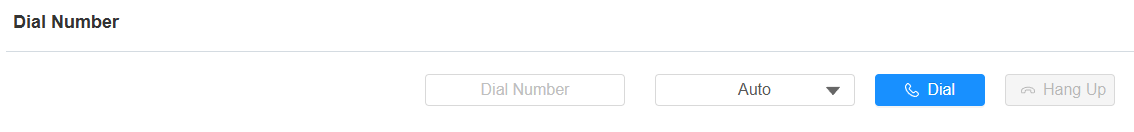
The web call feature allows for making calls via the device’s web interface, commonly used for remote call testing purposes.
To set it up, navigate to the Contacts > Local Contacts > Dial Number interface. Enter the target number and select the account to dial out.
Screenshots
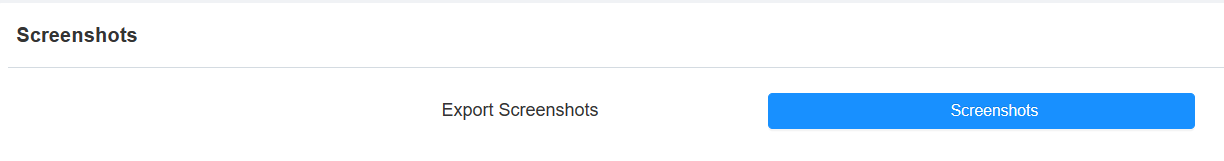
You can take a screenshot of the specific device screen to help with the troubleshooting and so on.
To take screenshots, go to Upgrade > Diagnosis > Screenshots interface, then click Screenshots.
Network Detection
You can use the network detection feature to quickly troubleshoot network problems.
Go to the Settings > Network Detection screen.
.bmp)
Diagnose: Tap to start detection.
Status: Display a loading icon when the detection starts; display ✔ for normal results and X for abnormal results.
Details: Tap to view the detection details.